In 2019, a PSA 10 2003 LeBron James Topps Chrome rookie sold for $96,000 at Goldin Auctions. In 2021, the same card in the same grade cleared $5.2 million. That's a 5,317% return in roughly 24 months — a number so absurd it sounds like a typo until you pull the auction records yourself. Meanwhile, the S&P 500 returned about 48% over that same stretch. The stock market crowd was thrilled. Card collectors were buying boats.
But that was then. The question serious collectors are asking now isn't whether alternatives to equities can outperform — the last five years proved they can. The question is: which categories have the data to back continued growth, which are running on fumes, and how do graded cards, rare coins, and blue-chip art actually stack up when you strip away the hype and read the numbers cold?
This week, we ran the tape. What we found is more nuanced than the boom-and-bust narrative suggests — and more actionable than most market commentary gives collectors credit for.
The Five-Year Scoreboard
Let's start with the benchmarks that matter. From January 2019 through December 2023, here is how representative assets performed across major collectibles categories compared to traditional financial instruments.
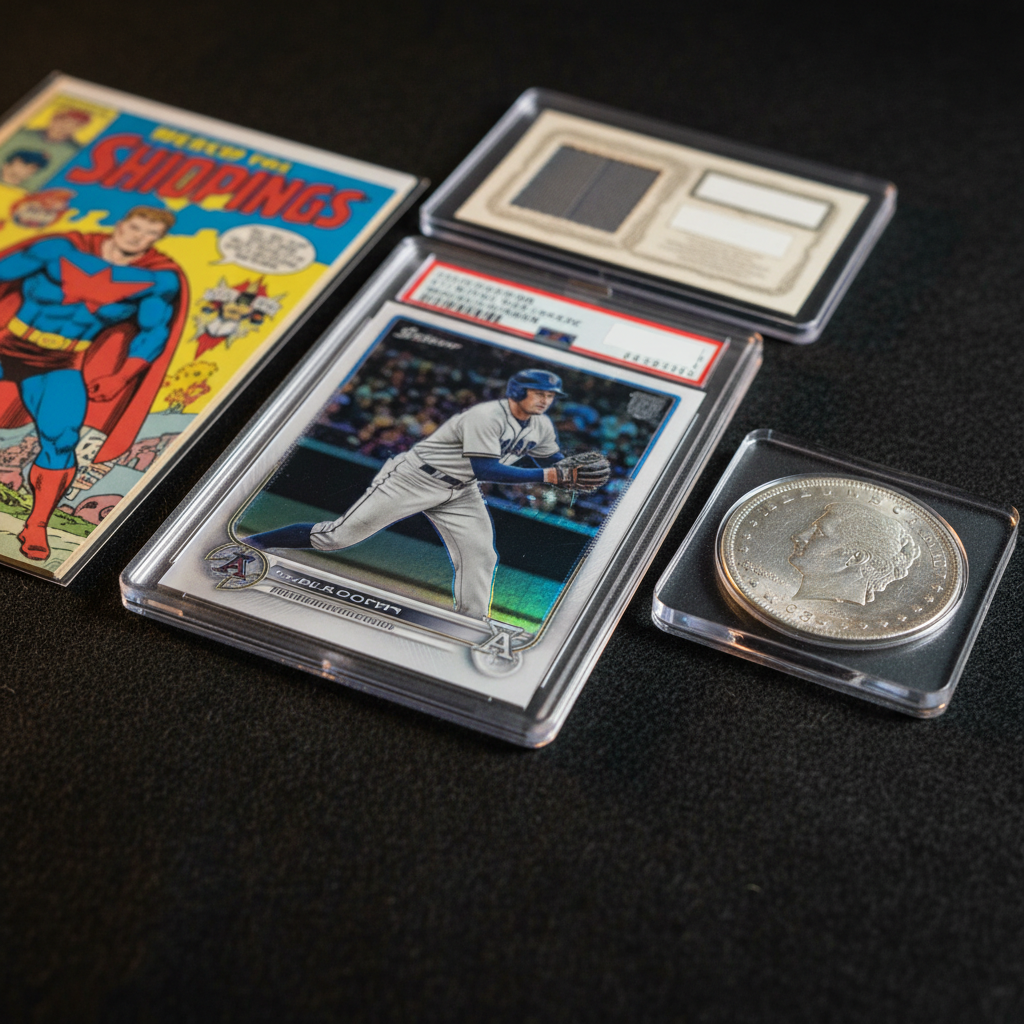
Graded Sports Cards (PSA 10 Tier, Vintage + Modern): Composite appreciation of approximately +380% to +5,300% depending on the specific card and exit timing. The range is enormous — and that range is the story.
U.S. Rare Coins (NGC/PCGS MS-65+ certified, key dates): Average appreciation of +62% to +140% across the PCGS3000 index from 2019 to 2023, with Morgan Silver Dollars and Saint-Gaudens Double Eagles leading the segment.
Blue-Chip Contemporary Art (Artprice100 Index): Appreciation of approximately +85% over the same period, with significant divergence between auction-house-represented artists and the secondary market.
S&P 500 (total return, dividends reinvested): +108% — the benchmark everything else gets measured against.
Gold (spot price): +72% — the safe-haven that underperformed its own reputation.
The cards look spectacular in isolation. But those numbers require context that most market cheerleaders skip over. The PSA 10 LeBron Topps Chrome at $5.2 million was a market peak. By late 2022, comparable examples were clearing closer to $2.1 million — still extraordinary, but a 60% drawdown that would have wiped out most equity investors. The coin market, meanwhile, didn't have a $5 million peak. It also didn't have a 60% crater.
Volatility is the price of admission for the highest-ceiling collectibles. Whether that price is worth paying depends entirely on your time horizon, your exit strategy, and how honest you are with yourself about both.